Permissions: ODR Read: Provides read-only access to the Operational Data Repository module.
ODR Analytics: Provides read-only access to the Operational Data Repository module and access to the Operational Oversight app in Analytics.
ODR Read Write: Provides read and write access to the Operational Data Repository module, including the ability to create issues. (Cannot access Field Configuration, manage Picklists, or access the Operational Oversight app in Analytics.)
ODR Configure: Provides read and write access to the Operational Data Repository module, including the ability to create issues, manage picklists, and configure fields (show / hide). (Cannot access the Operational Oversight app in Analytics.)
elluminate’s Operational Data Repository (ODR) provides the ability to import or manually add operational data into elluminate.
Important: Imported data overwrites currently entered data.
Access the Operational Data Repository
The Operational Data Repository is accessed using the 9-dot icon in the master header and selecting Operational Data Repository under Operational Insights.
The Home page, which displays Study Alerts, is the default view upon first accessing ODR. Users have the option to change their view to display studies by status or phase.
Users can use the left navigation to access any of the panels listed.
A blue badge next to each panel name in the left navigation indicates the number of records in that panel.
The blue badge in the header next to the Study Alerts, or the name of the study status or study phase indicates the number of studies in view.
Toolbar Actions
Use the toolbar at the top right in the master header.
- Search: Enter any part of a Protocol Name or Protocol ID in the Search field. The displayed studies update accordingly.
- Study Status icon: By default, view by Study Status is turned on. Click the icon to turn it off and view by Study Phase.
- Select Status icon: Use the drop-down to select the desired study status or study phase to view.
- Toggle Favorites icon: Use the Toggle Favorites icon (the star) to display only study cards marked as your favorites. To mark a study as a favorite, click the Favorite icon (the star) in a study card.
- Picklists icon: Click to open the Picklists window.
- Open Dashboard icon: Click to open the Operational Oversight app in Analytics. Only users with the ODR Analytics privilege see this icon.
- Open Fields Config icon: Click to open the Fields Config window. Only users with the ODR Configure privilege see this icon.
- Audit Trail icon: Click to open the Audit Trail prompts.
- Question mark: Click to open the drop-down with access to the Help Center, Community, Learning Portal, Support contact information, Privacy Policy, Legal Notices, and About version #.
View by Study Alerts
Studies that meet criteria based on default calculations are added to Study Alerts.
- Draft Protocol Date is Approaching: If Draft Protocol Date Actual is missing and Draft Protocol Date Planned is within the next 30 days
- Final Protocol is Approaching: If Final Protocol Date Actual is missing and Final Protocol Date Planned is within the next 30 days
- Screening Failure Rate (%) Is Exceeding Planned: If Screening Failure Rate (%) Actual is higher than Screening Failure Rate (%) Planned
- Enrollment Rate is Low: If Enrollment Rate Actual is Lower than Enrolment Rate Planned
- Number of Screen Failures is High: If Number of Screen Failures Actual is higher than Number of Screen Failures Planned
- First Site Activated Is Approaching: If First Site Activated Actual Date is missing and First Site Activated Date Planned is within the next 30 days
- First Subject Screened Is Approaching: If the First Subject Screened Actual Date is missing and First Subject Screened Planned is within the next 30 days
- First Subject In Is Approaching: If the First Subject In Actual is Missing and the First Subject in Planned is within the next 30 days
View by Study Status
Study status is retrieved from the information entered in the Study form. In the example provided, the status of 'completed' was selected. The header indicates the current view is by Study Status > Completed. Each study card displays the study name (a link to access the study's top-level form), study status, total actual sites, total actual screened subjects, and total actual enrolled subjects. Study statuses are defined in the Study Status picklist.
View by Study Phase
Studies can be displayed by Study Phase, categorized based on the data imported or entered into the system, such as different fields within Rates and Milestones.
Study phases include Planning, Active Pre-Enrollment, Active Enrollment, Completed, and Undefined.
Tip: If the Study Status field is not completed for a study, the study is in the Undefined phase.
Change Your Home Page View
Users can change their Home page view using the Study Status and Select Status icons in the master header.
By default, the Study Status view is on. This means the Select Status drop-down includes all study statuses and phases, as well as study alerts. When the Study Status icon is turned off, the Select Status drop-down includes Study Alerts and all study phases (Planning, Active Pre-Enrollment, Active Enrollment, Completed, and Undefined).
Change the View by Study Status / Study Phase
- The Study Status icon is shaded, indicating it is turned on. Click the icon to turn it off and view by Study Phase.
- Click the Select Status icon.
- From the drop-down, select either Study Alerts, the study status, or the study phase.
Study Cards
Items displayed on study cards vary depending on whether the view is by study alerts, study status, or study phase.
Study cards on the Study Alerts page.
Study cards on the Study Status page.
Study cards on the Study Phase page.
Items include:
- Hyperlinked Study Name: Click to open the Edit Study window (form).
- Study Details icon: Click to open the Study Details window displaying the Milestones timeline (if data are available) and Metrics by Phase.
- Favorites icon: Click to mark as a favorite.
- Protocol Name: The Study ID (Protocol ID) from the study's top-level form.
- Study Status: The study status retrieved from the study's top-level form.
- Total Actual Sites
- Total Actual Screened Patients
- Total Actual Enrolled Patients
- Study Phase specific metrics: The metrics displayed vary based on the study phase.
Navigation
To navigate to another panel, click any of the panels from the left navigation. Data listed has either been manually entered or imported. The Operational Data Repository holds data for Investigational Products, Programs, Studies, Study Sites, Sites, Organizations, Investigators, Personnel, Sponsors, Clinical Development Plans, Regulatory Submissions, Ethical Review Boards, Preferred Providers, and Protocol Deviations. The orange sideline indicates the panel currently being viewed.
Icons are available at the top right of the master header. Regardless of the open panel, the same icons display. See the ODR Icons table below for details.
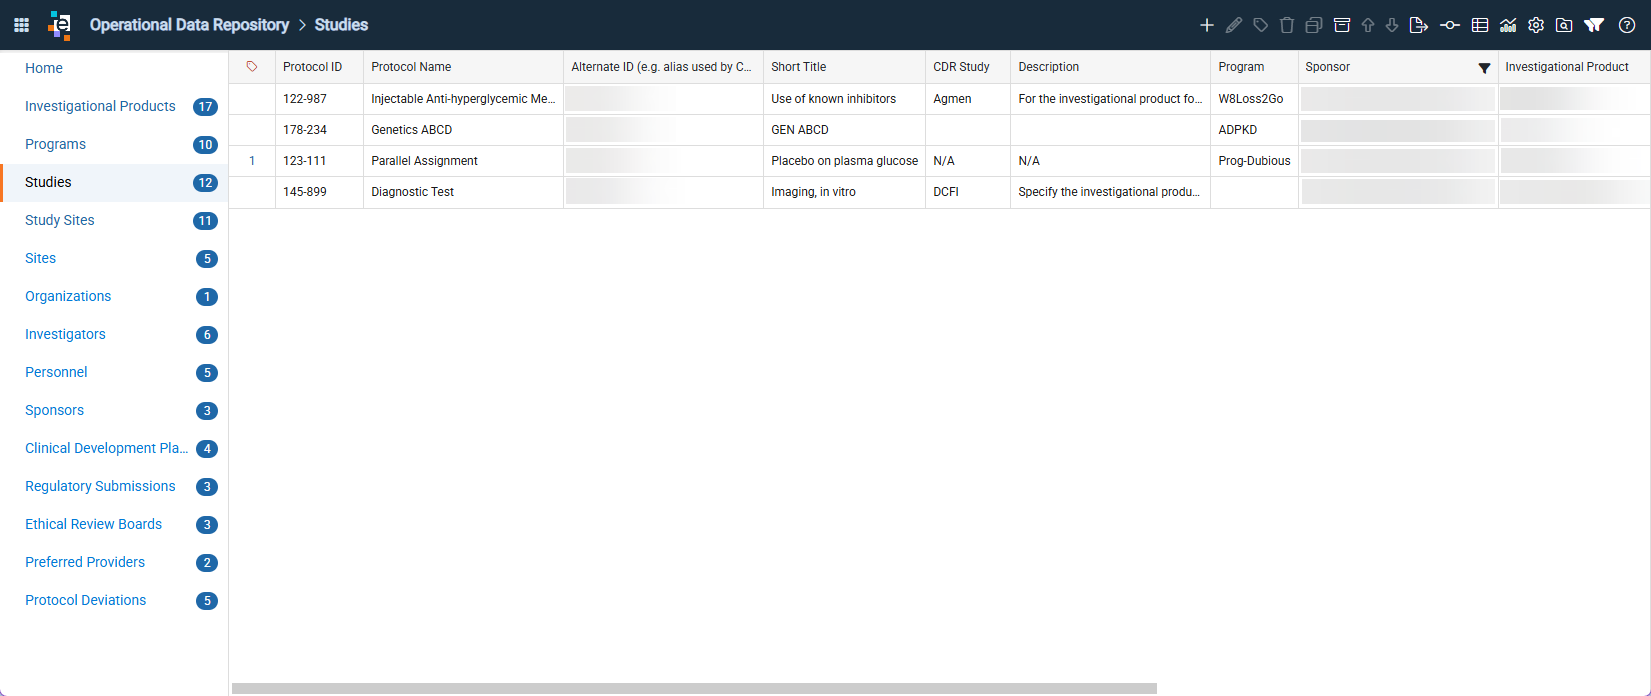
Grid (Listing) Functionality
Selecting a panel in the left navigation opens the associated grid (listing). For example, clicking on Investigators opens the Investigators listing. Most columns can be sorted, filtered, fixed, and moved.
Set a Column Filter
- Click the column header. A popout opens with sort and filter options.
- Click Filter.
- Select and add desired filter options.
- Select either Include Selections (defaulted) or Exclude Selections.
- Include Selections filters records where the selected values appear.
Exclude Selections filters records where the selected values do not appear.
- Optionally, select Blank Values to include records where the filtered column contains blank or null values. This option can be used with Include Selections or Exclude Selections to include or exclude blank or null data from the results.
Note: When applying Include Selections or Exclude Selections to numeric or date ranges, Include returns results that include the minimum and maximum values, while Exclude removes the minimum and maximum values from the results. - Select values from the list by checking the boxes or enter a letter or number string.
- Select either Include Selections (defaulted) or Exclude Selections.
- Select Filter Rows or Clear. These buttons become active after filter conditions are selected.
After a column filter is applied and Filter Rows is selected, the Filters icon in the toolbar becomes shaded, indicating that one or more column filters are applied to the listing. Filtered columns display a filter icon in the column header.
Clear Filter Conditions
In the listing with an existing row filter applied:
- Click column header.
- In the popout click Filter.
- Click Clear.
This clears all filters for that column.
OR
- Click the active Filters icon in the master header. This opens a popout with the following options:
- Select Clear Filters to remove all filters..
- View applied filters and click the red minus circle icon to remove individual filters.
Sort Columns
Most columns can be sorted in ascending or descending order. Columns that have been sorted display an arrow (facing up for ascending, facing down for descending) under the header, for easy identification.
- Click the column header.
- Select Sort Ascending or Sort Descending.
- To sort additional columns, hold the SHIFT key and click the column header, then select Sort Ascending or Sort Descending.
Fix and Unfix Columns
Columns can be fixed, or locked, to the left or right of a panel so the columns remain on the screen as the user scrolls right or left. Fixing columns is helpful when reviewing data and retaining specific fields for easier identification of each record.
- To fix a column, right-click the column header and select Fix, then select To the left or To the right.
- To Unfix a column, right-click the column header and select Unfix.
Tip: It is best to first fix columns to the left or right, then sort.
Adjust Column Width
When hovering over the header row, a grab bar appears, use this to adjust the width of a column.
Move Columns
Columns can be reordered by clicking on the column header and dragging it to a new location. The reordered columns remain until the user closes out of their session.
Access Open Issues
Records with open issues display a hyperlinked number in the Open Issues column. Click the link to open the Related Issues window. For more details on managing issues in the ODR refer to the Create and Manage Issues in the Operational Data Repository article.
ODR Icons
| Icon Action | DESCRIPTION |
|---|---|
| Create | Click the plus icon to create a new record in the active panel. Details for adding a new record are in the article Create and Manage Records in the Operational Data Repository. |
| Edit | Select a current record, then click the Edit icon to add or edit data. Data can also be edited by double-clicking a row. |
| Create Issue | Highlight a row and click the Create Issue icon to create an issue. |
| Archive Record |
Highlight a row, click the Archive Record icon, enter the reason for archiving the record, then click Save. to remove the record. A message displays that the record is successfully archived. Details are added to the audit log. If the record is in use in other panels a pop-up message displays indicating the record cannot be archived. Users must have the ODR Configure privilege to archive records. |
| Restore Archived Record | Click a row of an archived record (Is Archived=Yes), click the Restore Archived Record icon, enter the reason for restoring the record, then click Save. |
| Show Archived Records | Click the Show Archived Records icon to see all records, including archived records. This view includes 3 additional columns at the right of the listing, Is Archived, Archival Reason, and Restore Archival Reason. |
| Previous / Next Page | Click the arrow icons to move to the next or previous page in the listing, as available. |
| Export | Click for options to export the filtered list to Excel, or access the Exporter module in a new tab. |
| Number of Rows | Click the number of rows icon to select how many records display in the selected panel. The default is 50; other options are 100 and 500. |
| Picklists | Click the Picklists icon to add / edit / delete selections available from the drop-down list of values (LOVs) within all panels of the ODR, as well as export the Picklists. All users can export Picklists, but a user must have the ODR Configure privilege to manage picklists. |
| Open Dashboard | Click to open the Operational Oversight (OO) app in Analytics. Users must have the ODR Analytics privilege to access the Analytics app. |
| Open Fields Config | Click to open Fields Config window. The user must have the ODR Configure privilege to manage fields. |
| Audit Trail | Click to open the Audit Trail prompts. |
| Filters | Identifies if any filters have been applied. A solid filter indicates a filter is applied, while an empty filter indicates no filters have been applied. If a filter has been applied, click the filter icon to see which columns have a filter applied, and to remove the applied filter(s). |
| Question mark | Click to open a drop-down to select Help Center, Community, Learning Portal, Support information, Privacy Policy, Legal Notices, and About version #. |
Panel Summaries
Investigational Products
The Investigational Product panel displays information related to investigational products (IP). The panel supports adding and editing IPs and does not restrict the type of product created. Products may include drugs, combination products, devices, software, and other IP types. The panel provides flexibility to manage multiple IP types and is updated as new IP types are introduced in clinical trials.
Programs
The Programs panel links an individual study to a group of studies used to evaluate an indication or group of indications. The panel supports assigning studies to a program. All available studies display, along with all investigational products entered in the system. Investigational products can also be associated with the program.
Studies
The Studies panel captures details for studies in the Operational Data Repository. Study data can be entered manually or ingested from external systems. In both cases, editing and adding data is supported. Due to the volume of study information, additional sections display on the left side of the create and edit windows. Selecting a section opens the corresponding details on the right.
Role Histories are system-generated when a role changes and track changes to an individual’s role within a study.
Study Sites
The Study Sites panel associates sites with studies, indicating that a site is approved to participate in a study. Details can be added to define the study–site association. Due to the volume of related information, additional sections display on the left side of the create and edit windows. Selecting a section opens the corresponding details on the right.
Sites
The Sites panel stores site information. Data can be added manually or ingested from external systems, and existing data can be edited. The panel includes site physical address details, contact information, and specialties. Sponsor approvals apply to the site and indicate that the site is approved for use in a study.
Organizations
This panel stores information about organizations and supports association with one or more sites.
Investigators
This panel stores investigator details, including contact information and accreditations. Investigators can be associated with studies in other areas of the system.
Personnel
This panel records information for study or site personnel other than the Primary Investigator. Contact information and degrees or certifications can be added.
Sponsors
This panel records sponsor information. This is especially useful when multiple sponsors or a cosponsor are involved.
Clinical Development Plans
This panel captures details related to the Clinical Development Plan.
Regulatory Submissions
This panel records information related to regulatory submissions and supports submission tracking.
Ethical Review Boards
This panel tracks Ethical Review Boards (ERBs) used by the sponsor.
Preferred Providers
This panel tracks preferred providers used by the sponsor. Providers can be associated with studies in other areas of the system.
Protocol Deviations
This panel tracks protocol deviations.
Note: Protocol Deviation data entered in the top-level form and the Protocol Deviation Tracking subform within Studies is synchronized. Data entered in the Protocol Deviation Tracking subform is available in the Protocol Deviations top-level form; however, new records are added in a one-directional flow. Editing is supported in both forms, and synchronization of existing records is bi-directional. Synchronization applies only to predefined fields and does not include custom fields.
Best Practices
- Design the panel grids for easy review. In the field configuration, show only the relevant columns needed for an overview of the record. Sort, filter, and fix key columns to the left or right for stable scanning. Use the shaded Filters icon to confirm active filters, then export the filtered view when needed.
- Export ODR data with the right tool. For a quick Excel download of the current filtered grid, use the Export this data option. Use Open in Exporter for full exports that include richer options, especially for picklist fields.
- Use Issues for collaboration with other users. Create Issues directly from ODR listings or edit windows to capture context, assign owners, set due dates, and notify assignees by email. Track and action Items from the Related Issues window or the global Issues module.
- Manage record lifecycle with Archive / Restore. Use Archive (with a provided reason for archiving) instead of deleting records, then Show Archived Records to review or Restore (with a reason) when needed. Verify all changes in the Audit Trail to maintain traceability.
- Standardize data entry. When configuring input fields for records, utilize Picklists over free text and use multi-select fields where supported to minimize ambiguity. Remember to name custom picklists with the CP_ prefix and avoid entering duplicate values in picklists, as duplicate values cause an error.